 EN
ENMS-PA Stock Forecast & Morgan Stanley Chart Analysis
This article provides a detailed analysis of MS-PA-Morgan Stanley stock including a forecast for MS-PA shares. It features Morgan Stanley technical analysis, support and resistance levels, financial report evaluations, buy and sell signals based on simple moving averages and MACD, and artificial intelligence-assisted target price predictions
Stocks can be purchased through banks, brokerage firms, investment funds, and individual retirement systems.
MS-PA Historical Data Review
MS-PA Current Price Performance Analysis
The Morgan Stanley - MS-PA stock traded on the American stock market, on 06-05-2024, closed at 23.08$ with a %-0.22 decreased compared to the previous day.
In the last month, the price of MS-PA changed by %0.65 increased in value, from 22.93 dollars on 05-06-2024 to 23.08 dollars, increased.
Last year, the price of MS-PA was 21.14 dollars on 06-06-2023, and changed by %9.18 increased in value, to 23.08 dollars increased within a year.
The price of Morgan Stanley stock is riding high above the 50-day and 100-day moving averages. This means it's on a positive run for now, great news for those who got in early. But let's not take our eyes off the ball; no stock climbs forever.
MS-PA with AI Stock Forecast & Price Target
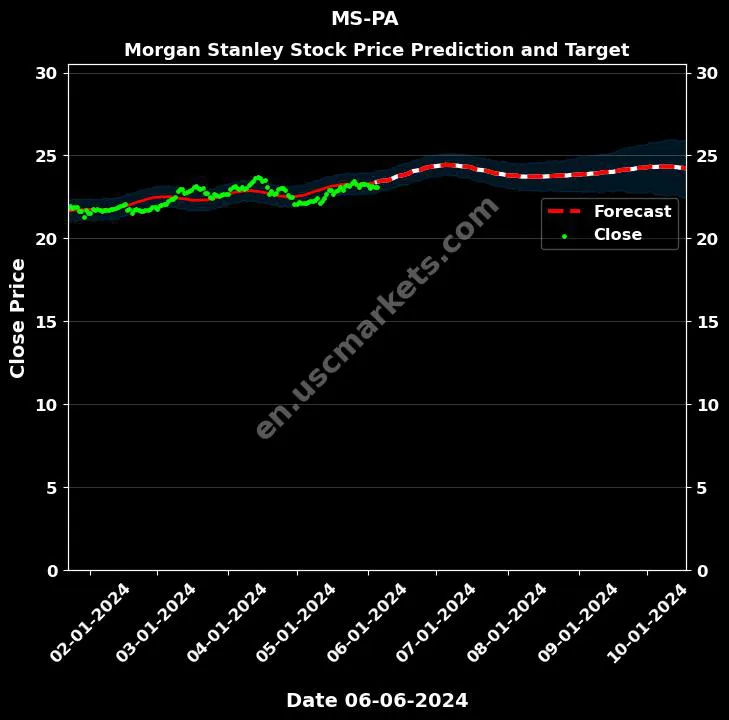
On the MS-PA chart Morgan Stanley price was recorded as 23.08 Dollars on 06/05/2024.
The artificial intelligence's forecast on MS-PA stock is as follows.
The artificial intelligence's prediction error margin for MS-PA stock is very high.
There are two types of risk factors in the artificial intelligence's targets: timing and target prices.
For example, the target price for one month later may be realized three months later. But there is no guarantee of this.
The average predicted price for Morgan Stanley stock over the next 4 months is: 24.4 Dollars.
The commentary on MS-PA stock Target Price: Highest: 25.151 Dollars is predicted.
The commentary on MS-PA stock Target Price: Lowest: 23.507 Dollars is predicted.
Resistance Price where Morgan Stanley stock will Rise and Fall:
| Date | Price Prediction |
|---|---|
| 07-05-2024 | 24.437 |
| 10-08-2024 | 24.323 |
| 12-02-2024 | 25.151 |
Support Price where Morgan Stanley stock will Fall and Rise:
| Date | Price Prediction |
|---|---|
| 08-09-2024 | 23.724 |
| 10-28-2024 | 24.137 |
| 01-16-2025 | 24.470 |
| 03-27-2025 | 24.494 |
The commentary on MS-PA stock: The target price can generally be said to be on the rise.
The commentary on MS-PA stock: Fluctuations in the target price can be expected in the coming days.
The target price for Morgan Stanley stock by the end of 2024 is predicted to be 24.702 Dollars.
The price prediction graph prepared with the help of artificial intelligence, the commentary on MS-PA stock, and the 2024 target price predictions for Morgan Stanley are detailed above.
The technical analysis and charts for the commentary on MS-PA stock are below.
MS-PA Support & Resistance and Trend Analysis
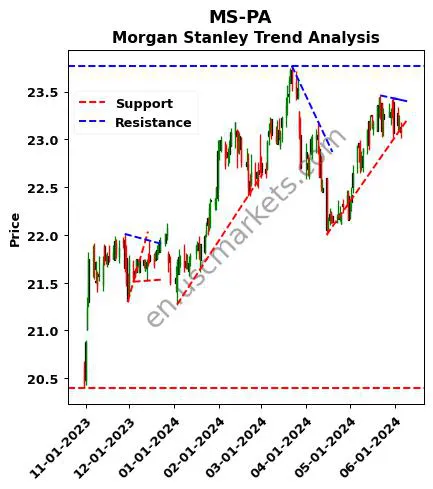
MS-PA stock you have reviewed the technical analysis support resistance charts regarding.
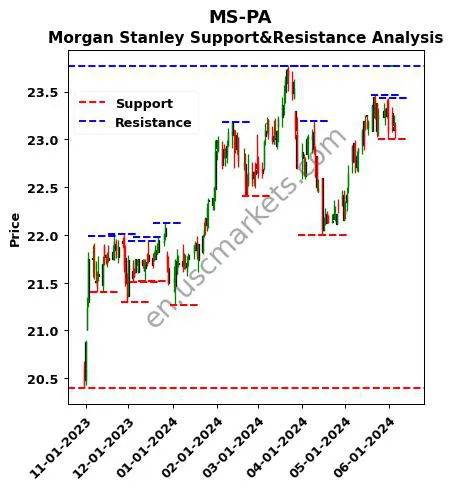
MS-PA : Targeting Support and Resistance Price Levels
According to the algorithmic analysis results related to the MS-PA review, the Morgan Stanley support and resistance prices are as follows.
Support and resistance levels on the chart are not absolute. They may vary depending on market conditions and macroeconomic indicators.
Morgan Stanley Support and Resistance Prices:
| MS-PA Support Level Price | MS-PA Resistance Level Price |
|---|---|
| 21.27 | 21.94 |
| 21.30 | 21.98 |
| 21.40 | 21.99 |
| 21.51 | 22.01 |
| 21.52 | 22.12 |
| 22.00 | 23.18 |
| 22.41 | 23.19 |
| 23.00 | 23.43 |
| 23.46 | |
| 23.77 |
MS-PA Technical Analysis: SMA, RSI, MACD
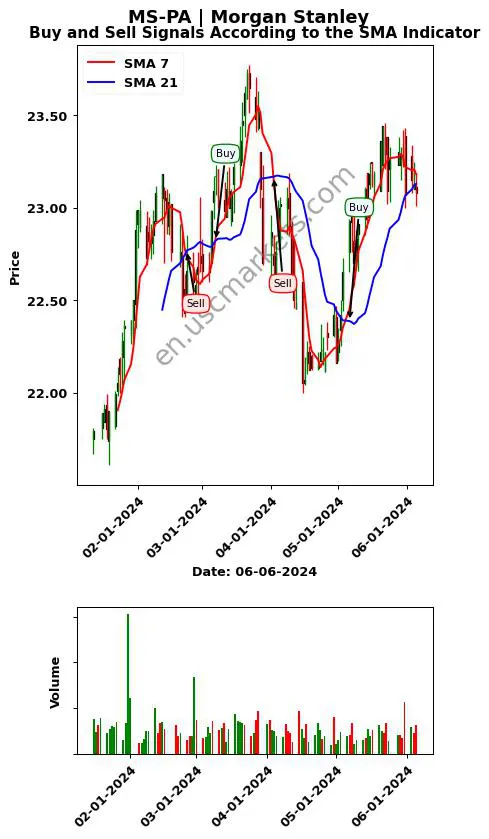
Upon reviewing the MS-PA chart, buy and sell signals have been generated in the Morgan Stanley technical analysis with technical indicators. There are over 100 technical indicators in the market. Each technical indicator can produce different signals.
However, please remember that technical analysis is only a tool and exact results cannot be guaranteed.
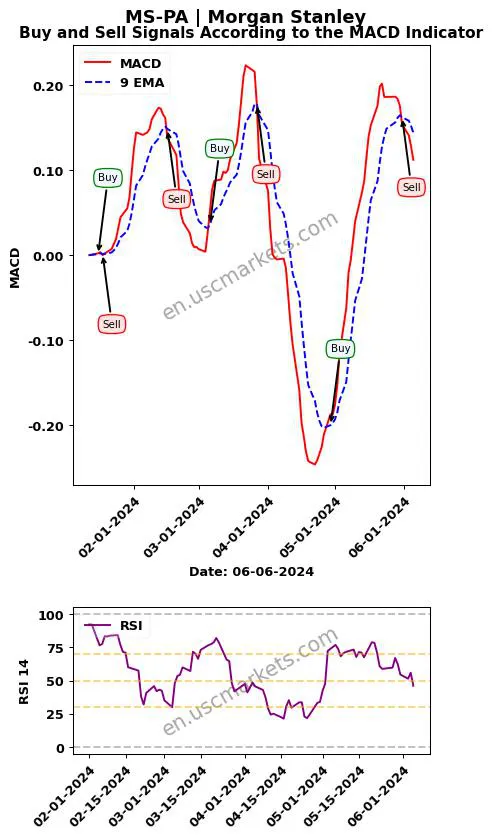
On The technical analysis chart and stock comments for MS-PA stock are as follows:- The technical analysis for MS-PA indicates that the 14-period RSI has most recently generated a 'Sell' signal.
- The technical analysis for Morgan Stanley indicates that the MACD indicator (with parameters 9, 12, 26) has most recently generated a 'Sell' signal.
Basic Technical Analysis Tips for Financial Markets
- Moving averages may not yield reliable results in stagnant, sideways markets.
- According to MACD technical analysis, the most optimal buying opportunity is a 'Buy' signal given when the MACD is below the 0 level.
- An RSI crossing below 70 is used as a sell signal, and a crossing above 30 is used as a buy signal.
- During a strong upward trend, the RSI can rise above 70 and stay there.
- No indicator is perfect. Having indicators corroborate each other can increase the chances of success.
- Instead of fully relying on these indicators for your investment decisions, it is recommended to conduct a comprehensive analysis and consult a professional financial advisor.
You have read the comments, technical analyses, target prices, and financial reports for Morgan Stanley stock: Click here to read more predictions on Equinix stock.
Click here for price target predictions and technical analysis charts of other American stocks